View profiling attributes applied to elements
Profiling lets you identify conditional text so that you can produce more than one version of a document when the versions differ in minor ways. Profiling attributes are hidden by default but you can display them.
 Tips and tricks
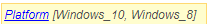
- Profiling attribute values are displayed in a yellow box below the green box. If you hover your cursor over the green box, you'll see the name of the attribute in blue, followed by the values inside the brackets [ ]. For example, in this tool tip the attribute is Platform and the values are Windows_10 and Windows_8.
- Show profiling attributes by default. When you first open the Oxygen editor, you don't see profiling attributes until you click the closed eye icon
 .
. - If you want to see profiling attributes whenever you open a component, make sure to display them before you close the editor.
- If the show attributes icon is an open eye
 , the editor remembers your settings and shows profiling attributes the next time you open a component.

To view profiling attributes applied to elements:
-
Click
 Components.
-
In the Components pane, right-click the component and then select Edit...
 You can access the same menu by clicking
  the Options menu.
 -
To show profiling attributes, in the toolbar, click this icon .
-
To see which attribute values are applied to an element, put your cursor in the text where the attribute is applied.
- Profiling attribute values are displayed in a yellow box below the green box.
- You'll see the name of the attribute in blue, followed by the values inside the brackets [ ]. For example, in this tool tip the attribute is Platform and the values are Windows_10 and Windows_8.
-
To hide the attributes, in the toolbar, click this icon .