View a map asset report for one component
You can use a DITA map to organize a set of resources, such as topics, into a hierarchy. This feature is useful when producing structured content, such as XHTML, PDF, or Windows Help. You can view a report to see all of the components referenced in your map, including topics, images, and other maps.
 Tips and tricks
- The Map asset report option is also available when working on a project.
 View a map asset report for a project component.
 - You can see the Report Date before the table of data. Knowing the date and time that the report was requested is important if you are forwarding the report notification or the report itself
- The report contains the following information:
 If a map has been sent to translation, you see:
- In Language, the Target language that the source was translated into
- In Update Date, the last date when it was sent to translation
- In Last Translation Date, the last date when it was sent to translation

To view a map asset report for a component:
-
Click
 Components.
-
In the Components pane, do one of the following:
- Use the Selected Components panel.
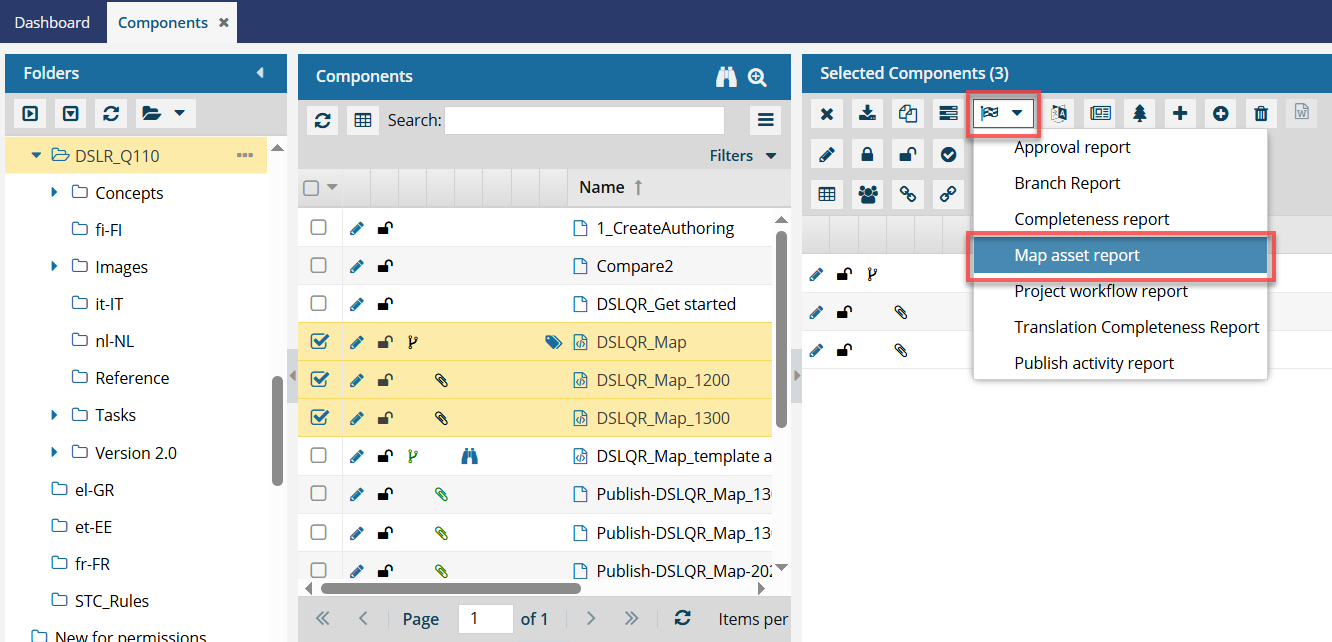
- Select the checkbox for the map(s) you want to run a report on.
- On the Selected Components panel, select
 Reports, and then Map asset report.
- Use a menu.
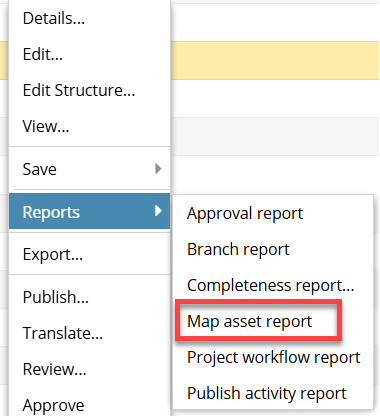
- In the map component's row, right-click OR select
 the Options menu.
 - Select Reports, and then Map asset report.
- In the map component's row, right-click OR select
 Results: You see a notification that the report is being generated.
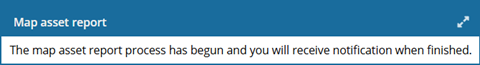 You see another notification when the report has been created.
- Use the Selected Components panel.
-
In the top menu, click
 Notifications.
 You do not receive a copy of the report in email or Slack and it cannot be configured.
 -
From the list of notifications, select the one that says Map Asset Report.
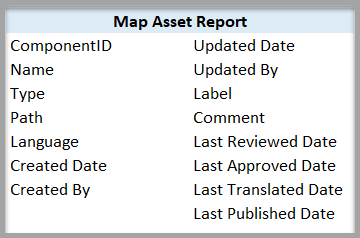
Results: In the Details pane, you see the following report:
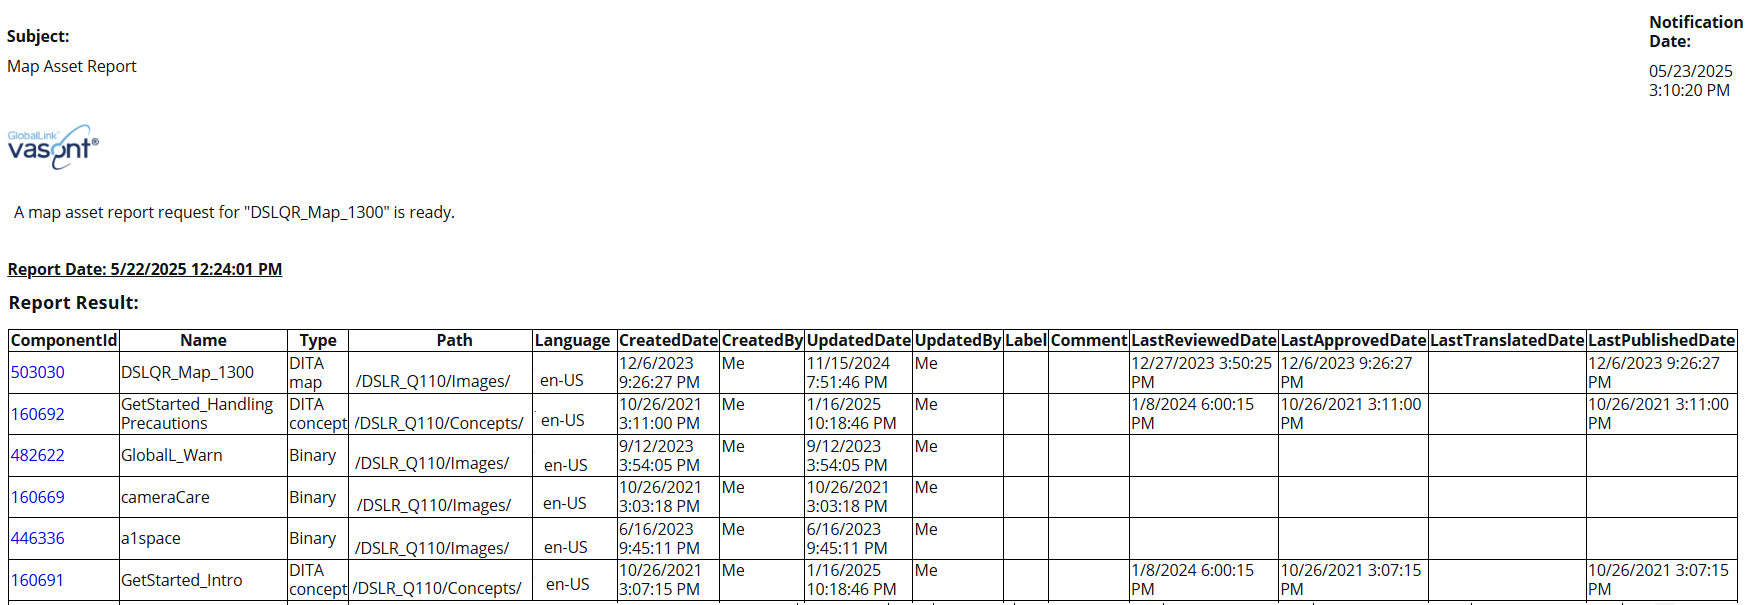
The left side of the report tells you how to identify the component that is referenced in the map.
- ComponentID
- Name
- Type
- Path
- Language (en_US if the map has not been translated)
- CreatedDate
- CreatedBy
- UpdatedDate (If the map has been translated, this is the last date when it was sent)
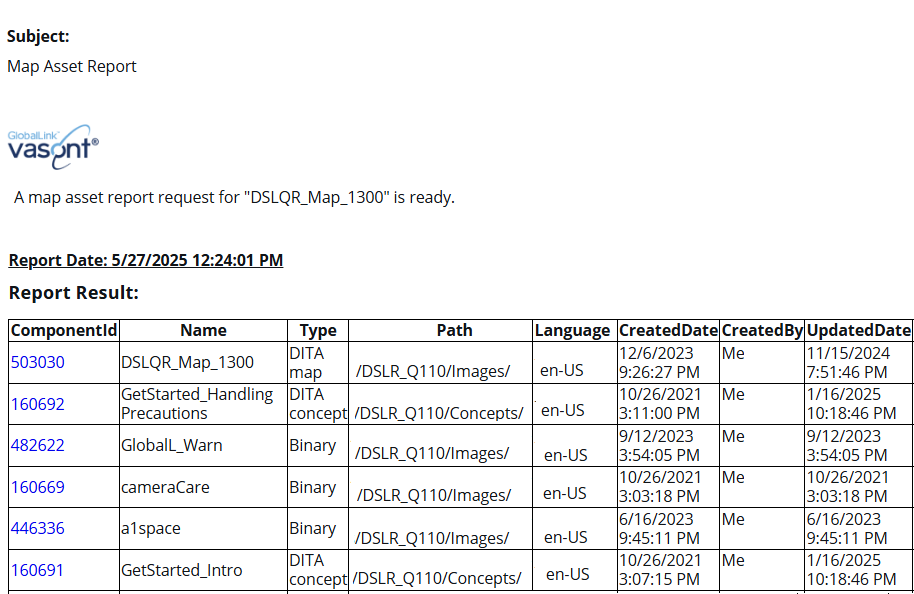 You can click the link in ComponentID to go to the Components browser and see the location of the component. The component is highlighted.
The right side of the report tells you more about the kinds of updates made to the component.
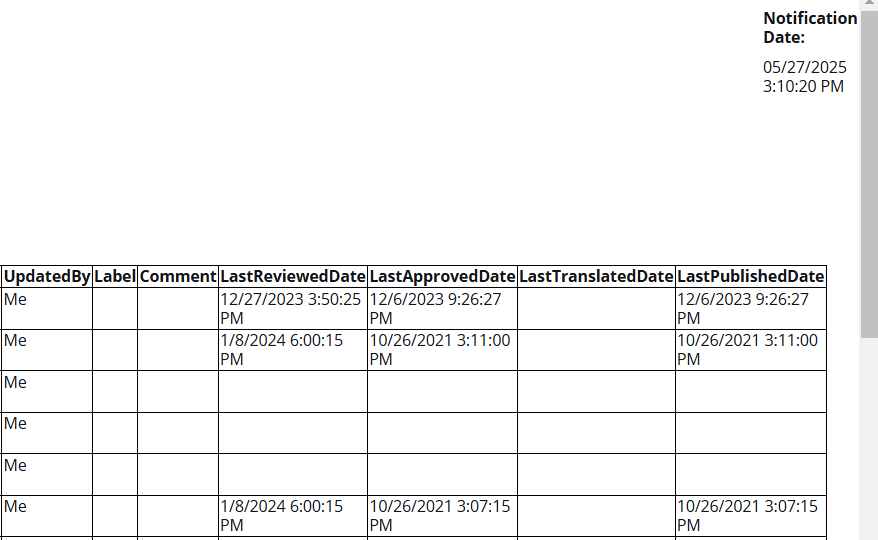
- UpdatedBy
- Label
- Comment
- LastReviewedDate
- LastApprovedDate
- LastTranslatedDate
- LastPublishedDate